

Open House 2026, Indian Institute of Technology Delhi · October 31, 2026
Microscopy without Lenses Digital Lensless In-line Holographic Microscopy (DLIHM)
Conventional cameras and microscopes form an image by using lenses to project the scene onto a sensor. Lenses make these systems bulky and costly, and the intensity images they record do not reveal the sample's optical thickness (phase).
Computational imaging splits the work differently: the optics only encode the sample into a measurement, and a computer decodes it using a physical model of how light travels. In digital lensless in-line holography we record a diffraction pattern that encodes both the absorption and the phase of the sample, and solving the inverse problem recovers both. The result is a compact, low-cost technique for large field-of-view quantitative phase imaging.
Conventional imaging vs computational imaging
In a conventional system the lens does the image formation. In a computational system the hardware only records a measurement, and the image is reconstructed by solving an inverse problem.
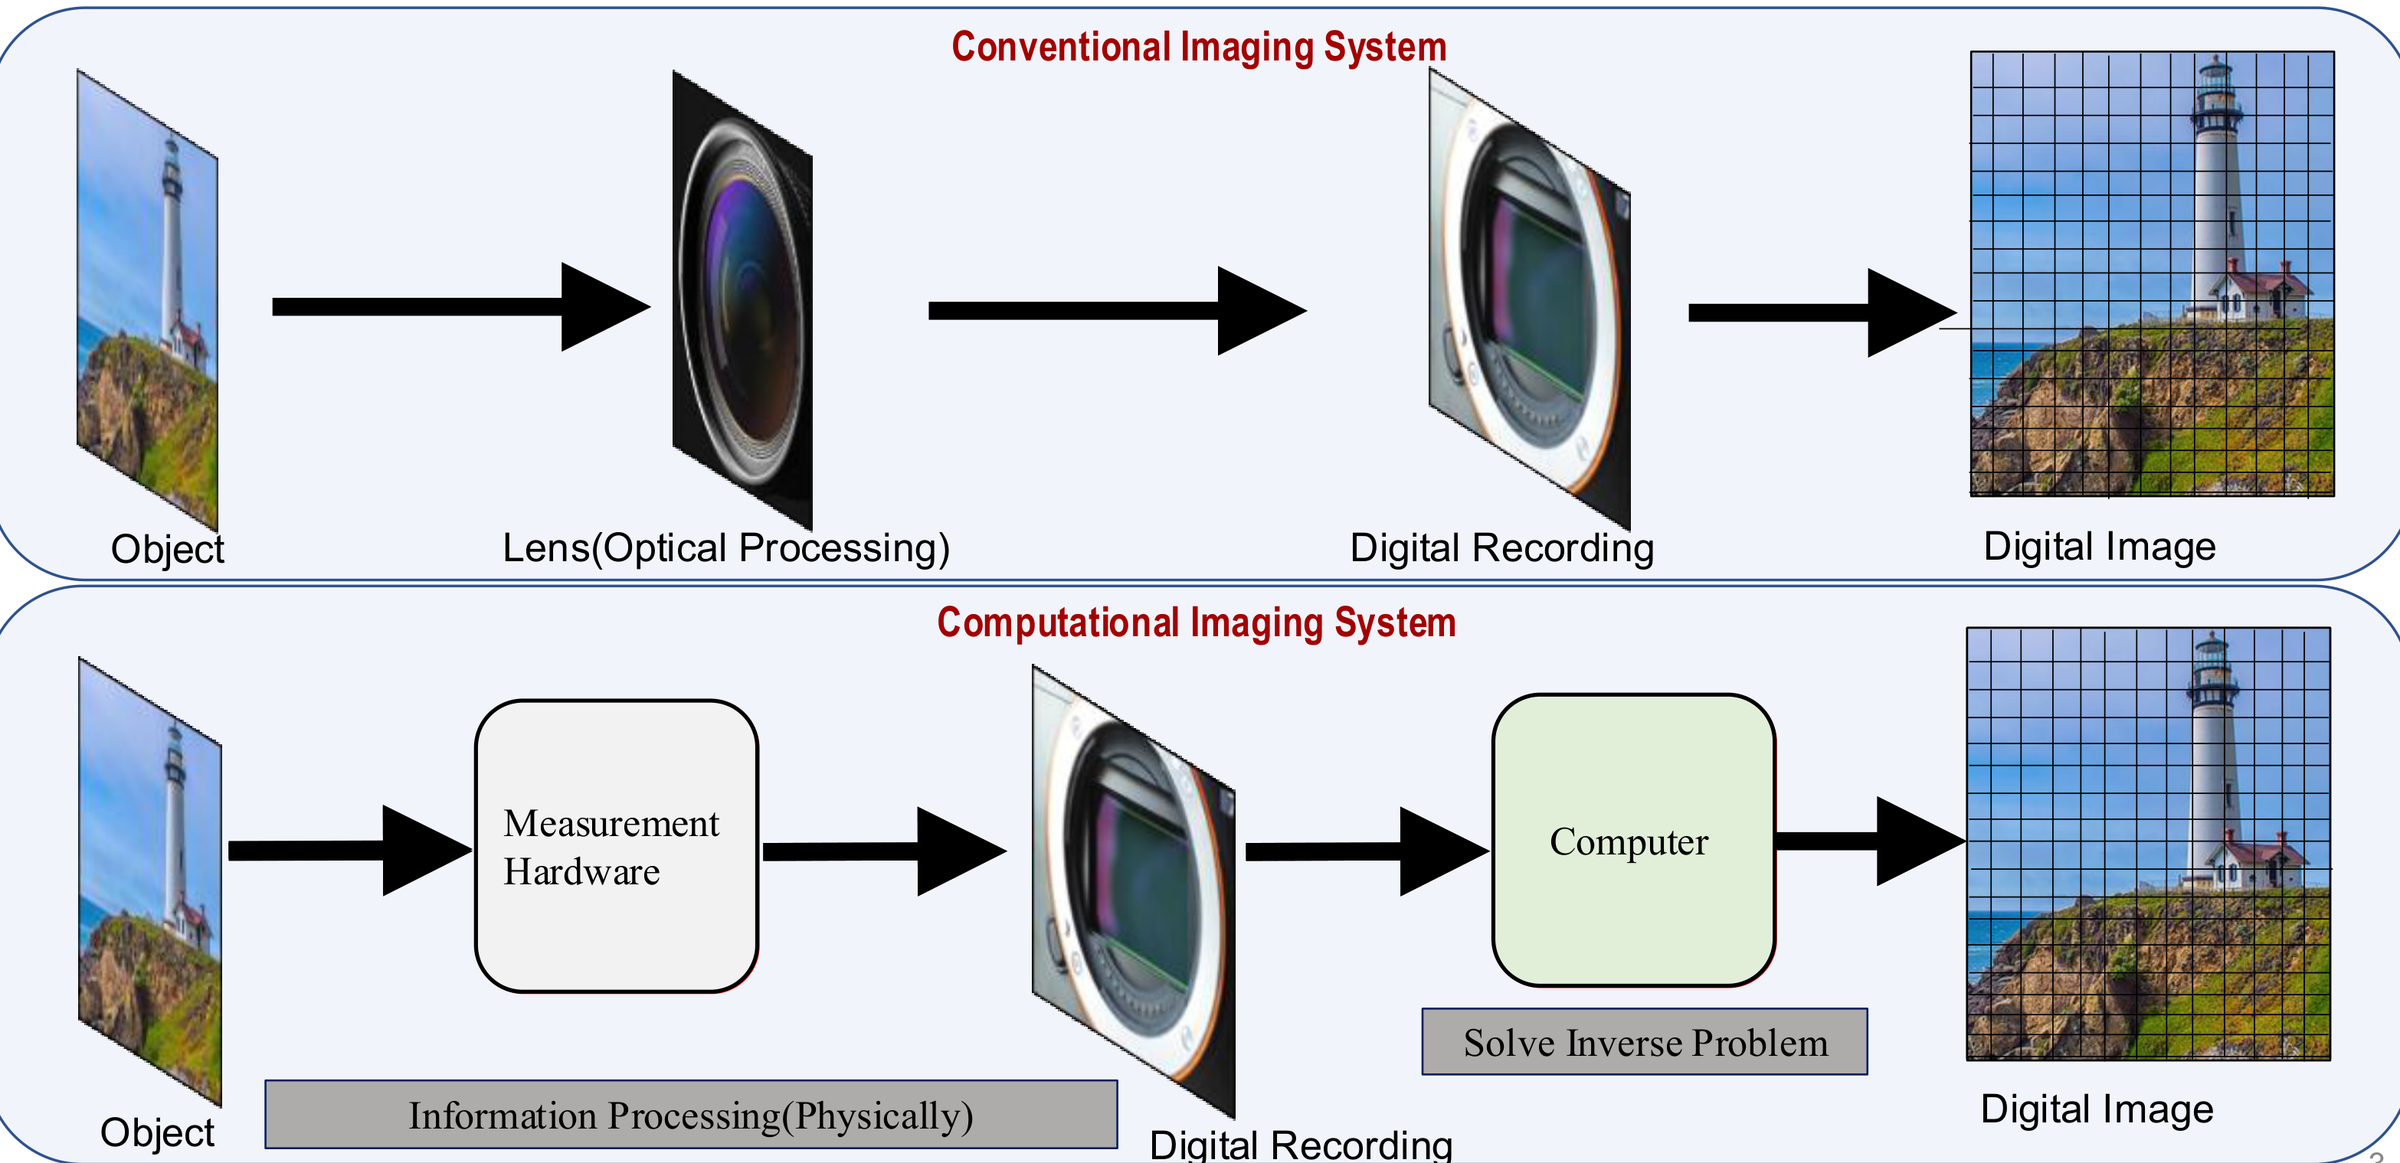
Conventional vs lensless microscopy
| Field of view | Optics | Phase (thickness) | Size & cost | |
|---|---|---|---|---|
| Conventional microscope | ~0.1–2 mm², limited by the objective lens | Objective lenses, precise alignment needed | Not measured (intensity image only) | Bulky, expensive bench-top instrument |
| Lensless (DLIHM) | ~20–30 mm², the entire sensor area | No lenses: LED/laser and a camera chip | Measured quantitatively (optical thickness map) | Compact, low-cost, portable |
What the camera actually records
Choose a sample and move the sensor away from it. Close to the sample you see near-field (Fresnel) diffraction, the regime lensless microscopes work in. Far away the pattern turns into far-field (Fraunhofer) diffraction.
Sample (z = 0)

Camera image at distance z
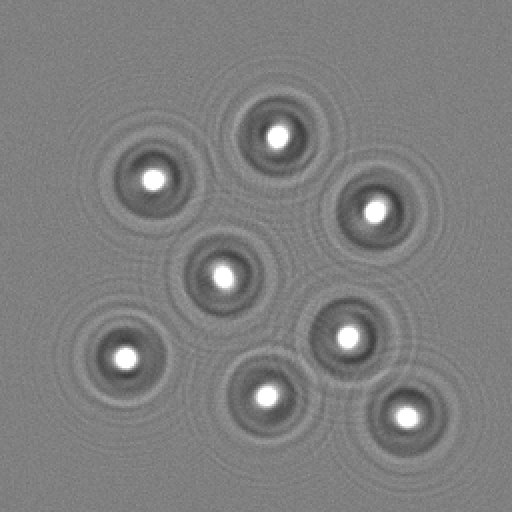
How these images were made: each sample is a complex transmission \(A\,e^{i\phi}\) (phase objects are modelled with realistic refractive indices and thicknesses). It is propagated with the band-limited angular spectrum method up to 10 mm and with the Fresnel diffraction integral beyond that. The intensity is integrated over 1.85 µm camera pixels, photon and read noise are added, and every frame is saved as an image. The wavelength and pixel size match our setup. The shaded band on the slider marks the distances used in our experiments and simulations.
Limitations of lens-based microscopes
Why it is worth removing the lens.
Field of view shrinks with magnification
Transparent samples are almost invisible
Shallow depth of field
Size, alignment and cost
Working principle: recording and reconstruction
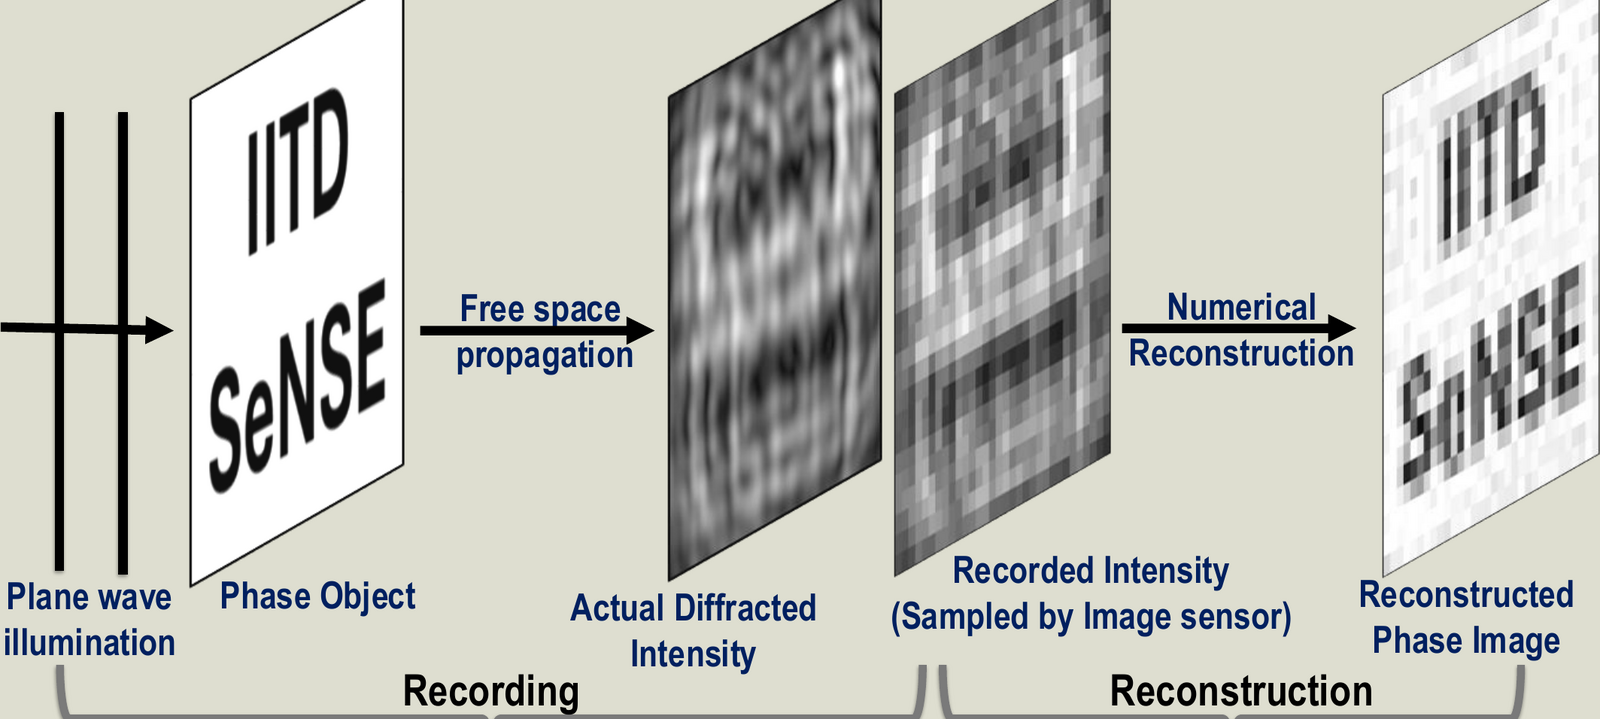
The camera records the intensity of the diffracted light. The image is recovered by solving an inverse problem with a physical model of propagation.
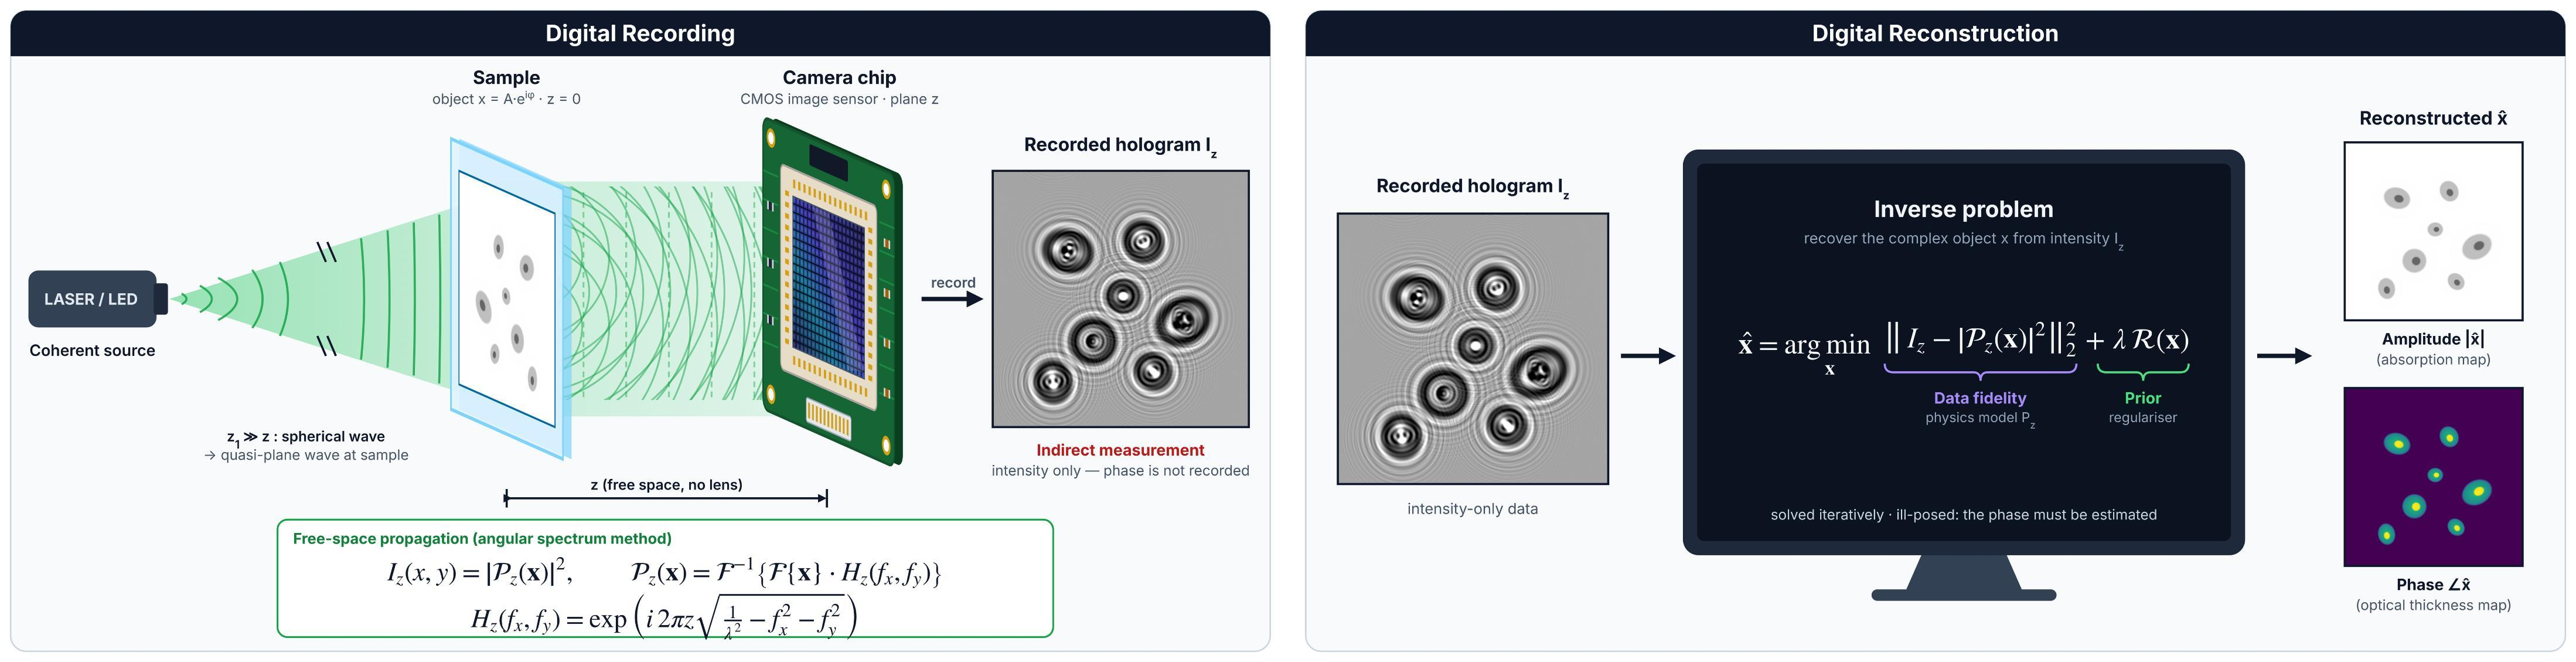
Forward model
A coherent plane wave illuminates the object \(x = A\,e^{i\phi}\) at \(z = 0\). Free-space propagation to the camera at distance \(z\) is modelled with the angular spectrum method:
Inverse problem
The phase is not recorded, so it has to be estimated. We solve, iteratively,
The first term keeps the estimate consistent with the measurement (data fidelity through the physics model). The regulariser \(\mathcal{R}\) adds prior knowledge about the sample. The amplitude \(|\hat{x}|\) gives the absorption map and the phase \(\angle\hat{x}\) gives the optical thickness map.
Two difficulties
Our setup
A light source, the sample, and a bare camera sensor a few millimetres below it. There are no lenses between sample and sensor.
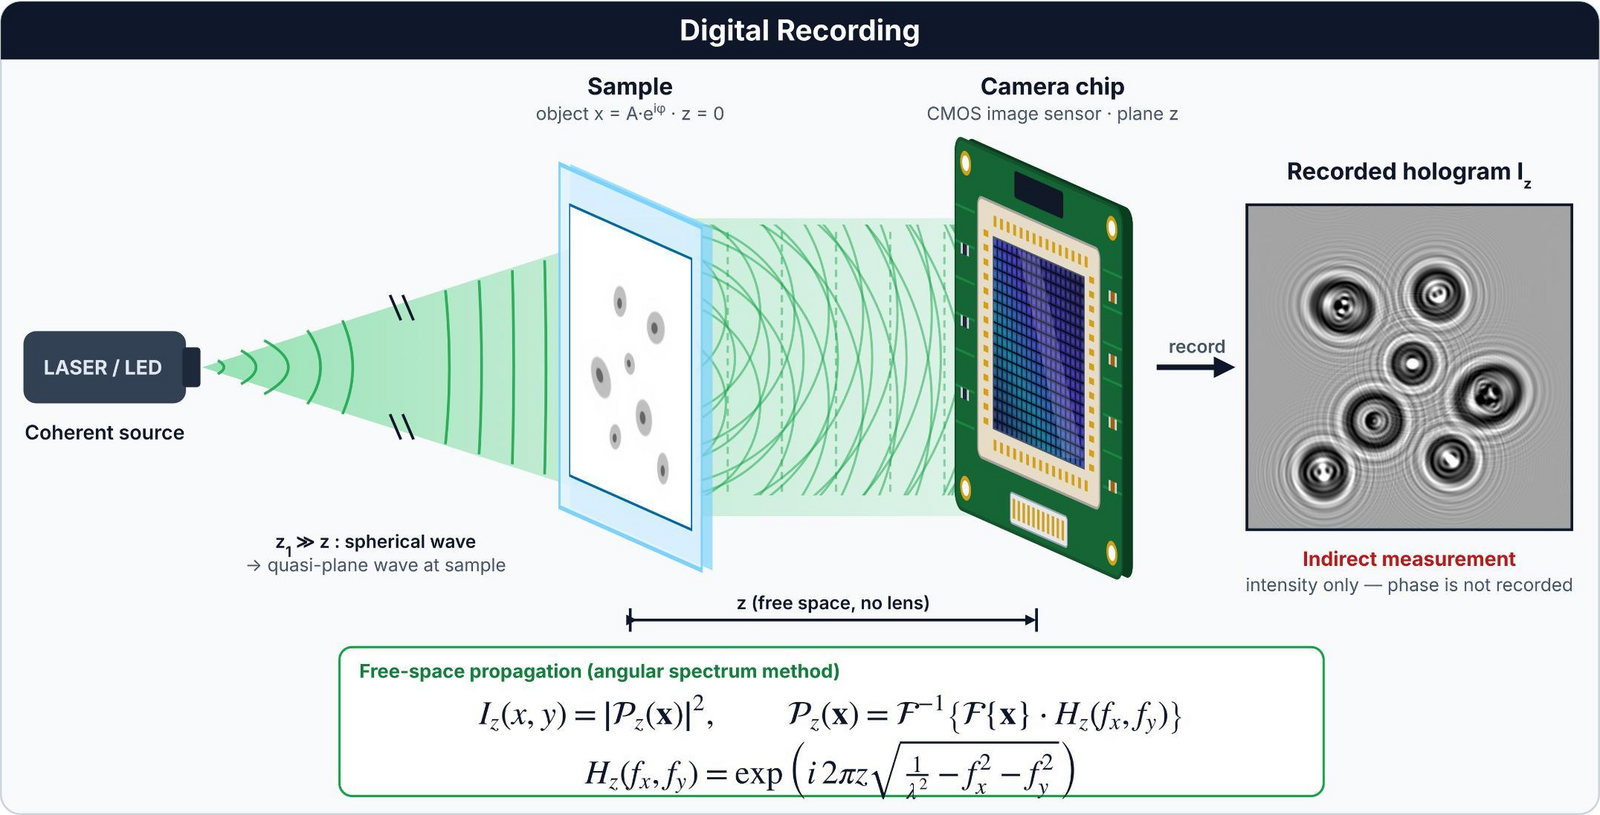
| Illumination | Coherent source (laser / LED), wavelength 535 nm |
|---|---|
| Camera | CMOS sensor, 4000 × 3000 pixels (12 MP), pixel pitch 1.85 µm |
| Sample-to-sensor distance | A few millimetres; our USAF-chart recordings used 4.45–6.02 mm |
| Imaging optics | None between sample and sensor |
| Recording | A single hologram, or several holograms at different sample-to-sensor distances for multi-height phase retrieval (for example 12 holograms between 6 and 7.2 mm, 0.1 mm apart, for the USAF chart) |
Numerical refocusing and autofocus
A hologram can be back-propagated to any plane, so focusing becomes a computation instead of a knob. To find the sample plane automatically we look for the plane where the total variation (TV) of the reconstruction is lowest.
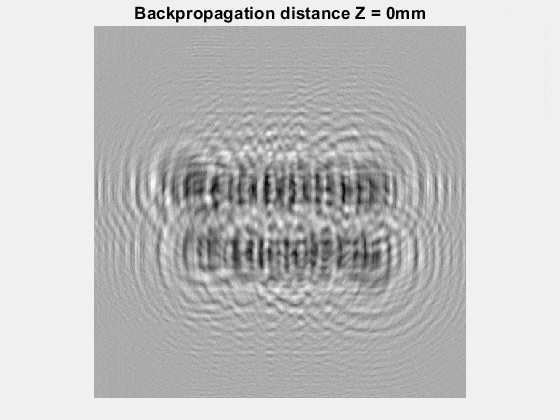 defocused
Back-propagations of a simulated in-line hologram of a text target placed 10 mm from the sensor, computed for 27 distances between 0 and 20 mm.
TV of the back-propagated field, computed between 6 and 14 mm (values ×106). The sharp minimum at 10 mm is the object plane.
Experimental results
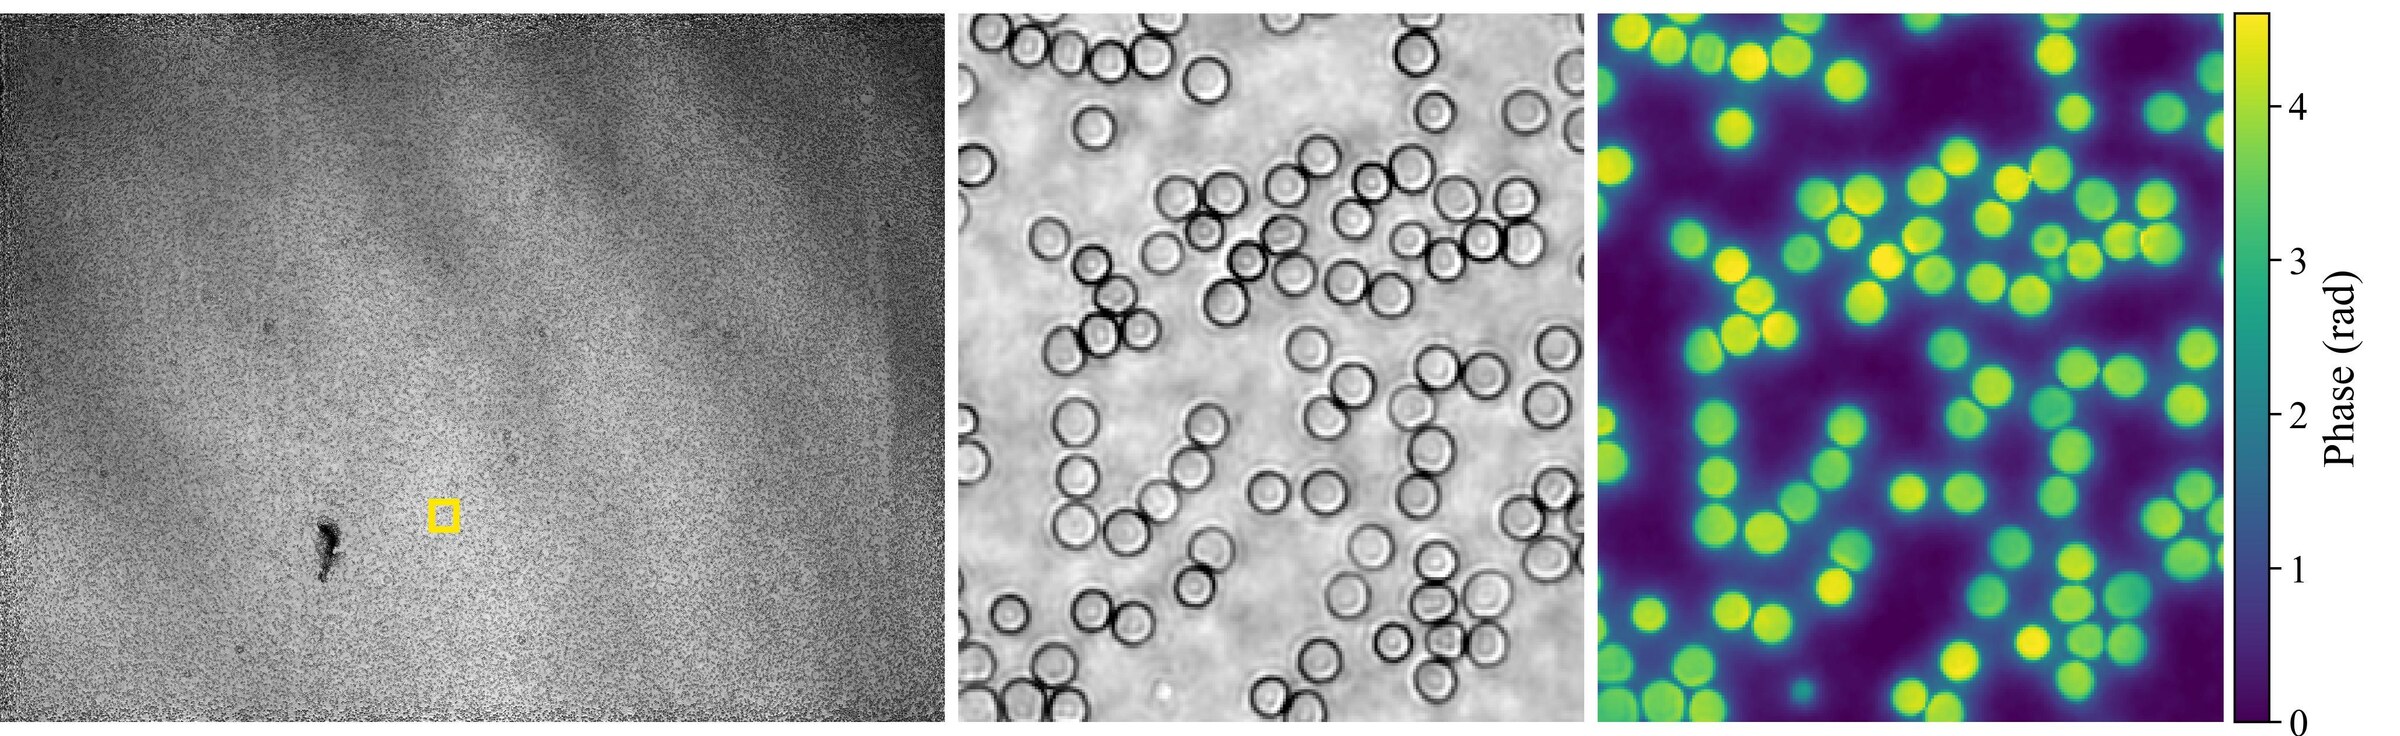
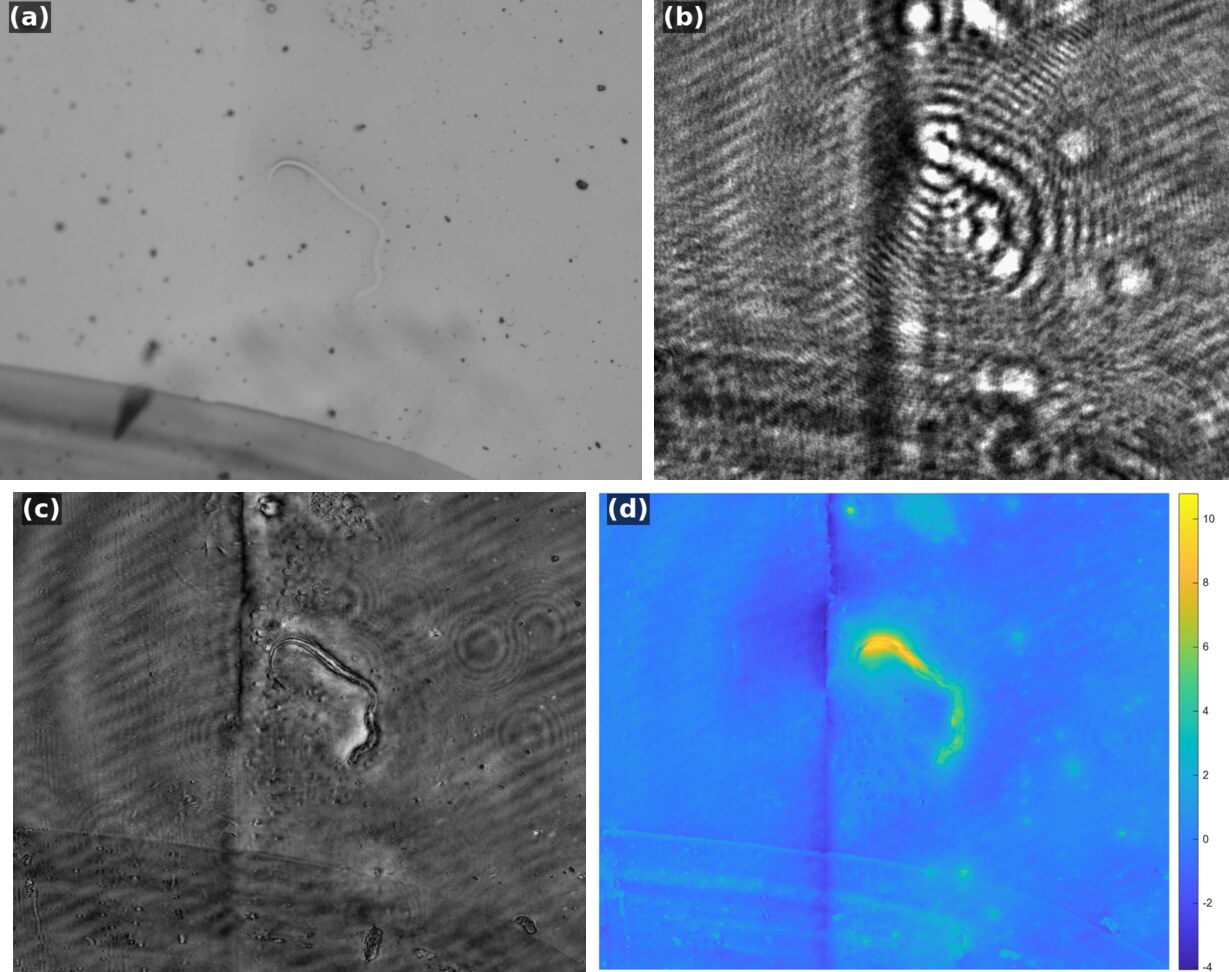
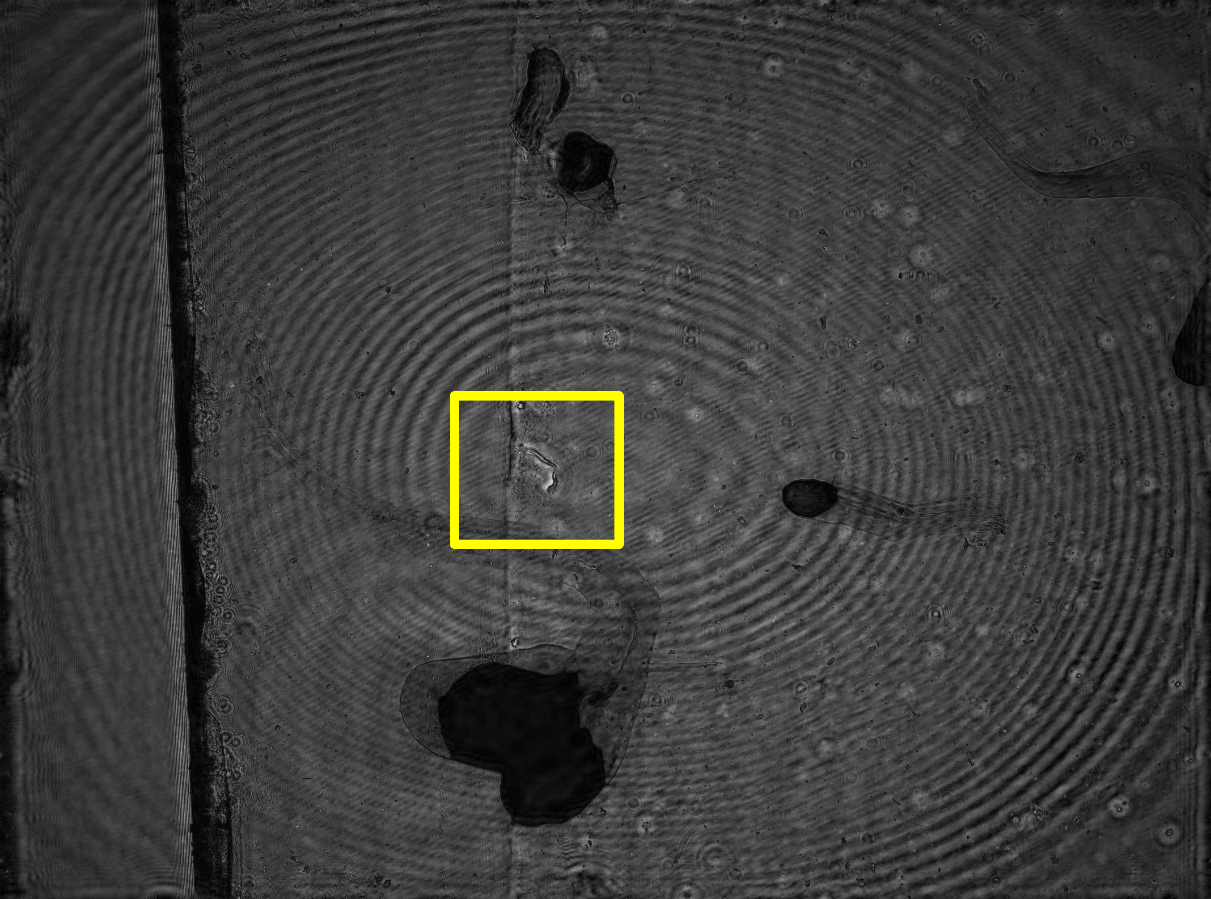
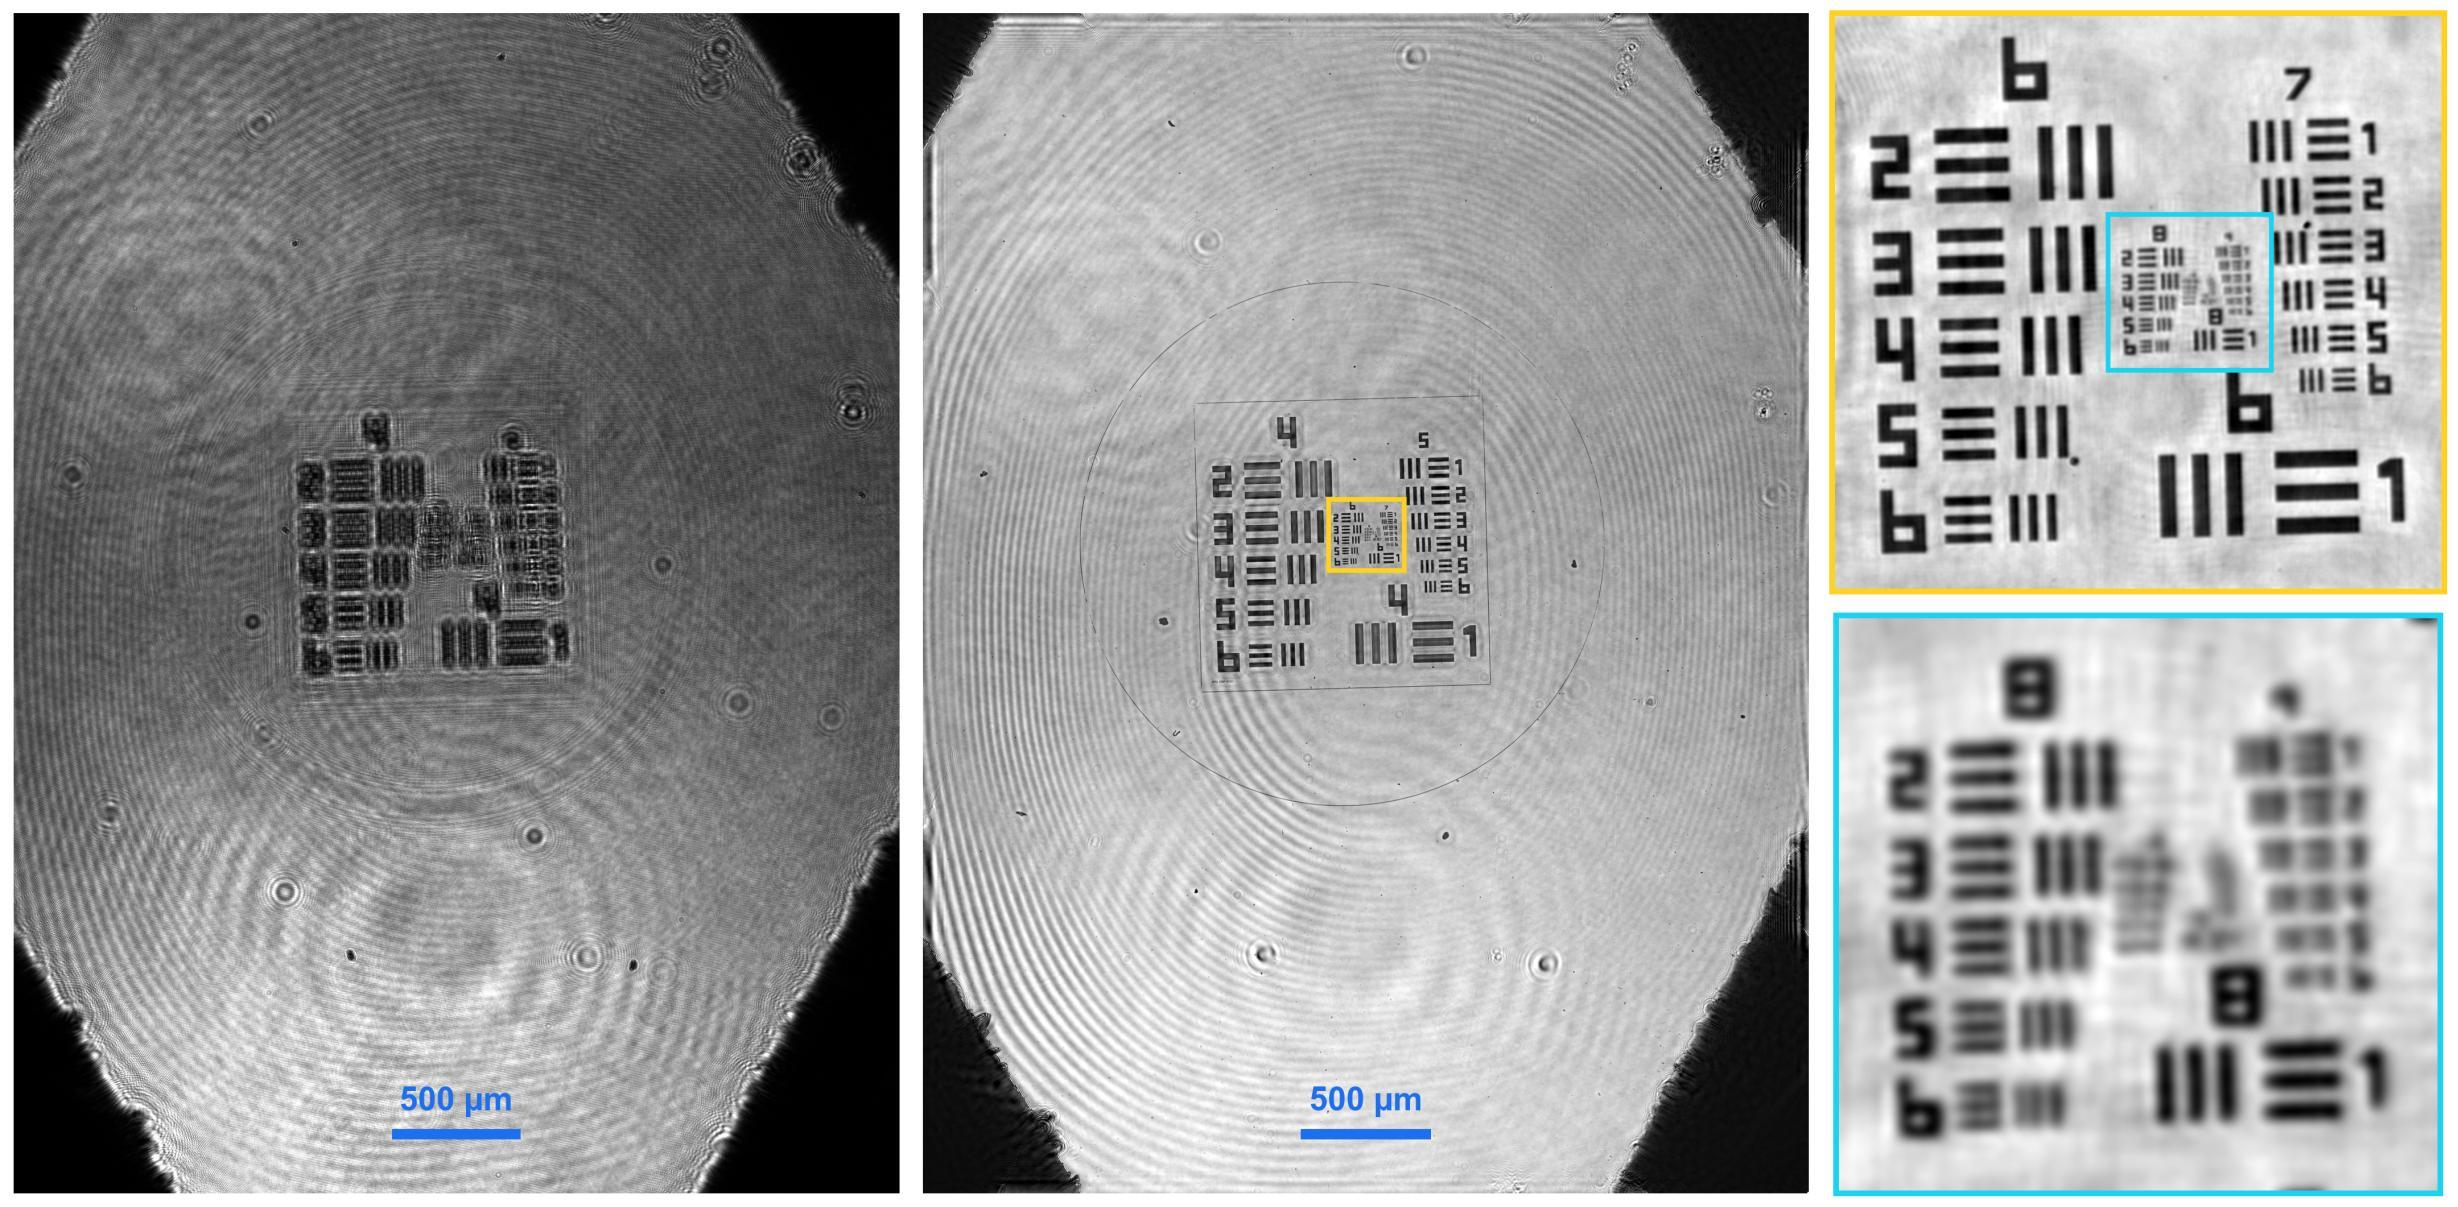
Holograms recorded with our lensless setup and their reconstructions. Click a figure to enlarge it.
Beating the pixel limit with a single hologram
Our work on single-shot pixel super-resolution for DLIHM, published in Applied Optics.
The problem
Placing the sample close to the sensor gives a wide field of view, but the finest diffraction fringes are then smaller than a camera pixel. Each pixel averages them, frequencies above the Nyquist limit \(1/(2\Delta p)\) alias, and resolution is limited by the pixel pitch rather than by diffraction. Existing pixel super-resolution methods record several holograms (shifted source, sample or sensor; several heights; several wavelengths). That needs extra hardware and precise registration, and it sacrifices temporal resolution.
Question: can a finite object support, combined with recording the diffraction pattern over an area larger than the object, give enough information to recover sub-pixel detail from a single, heavily undersampled measurement?
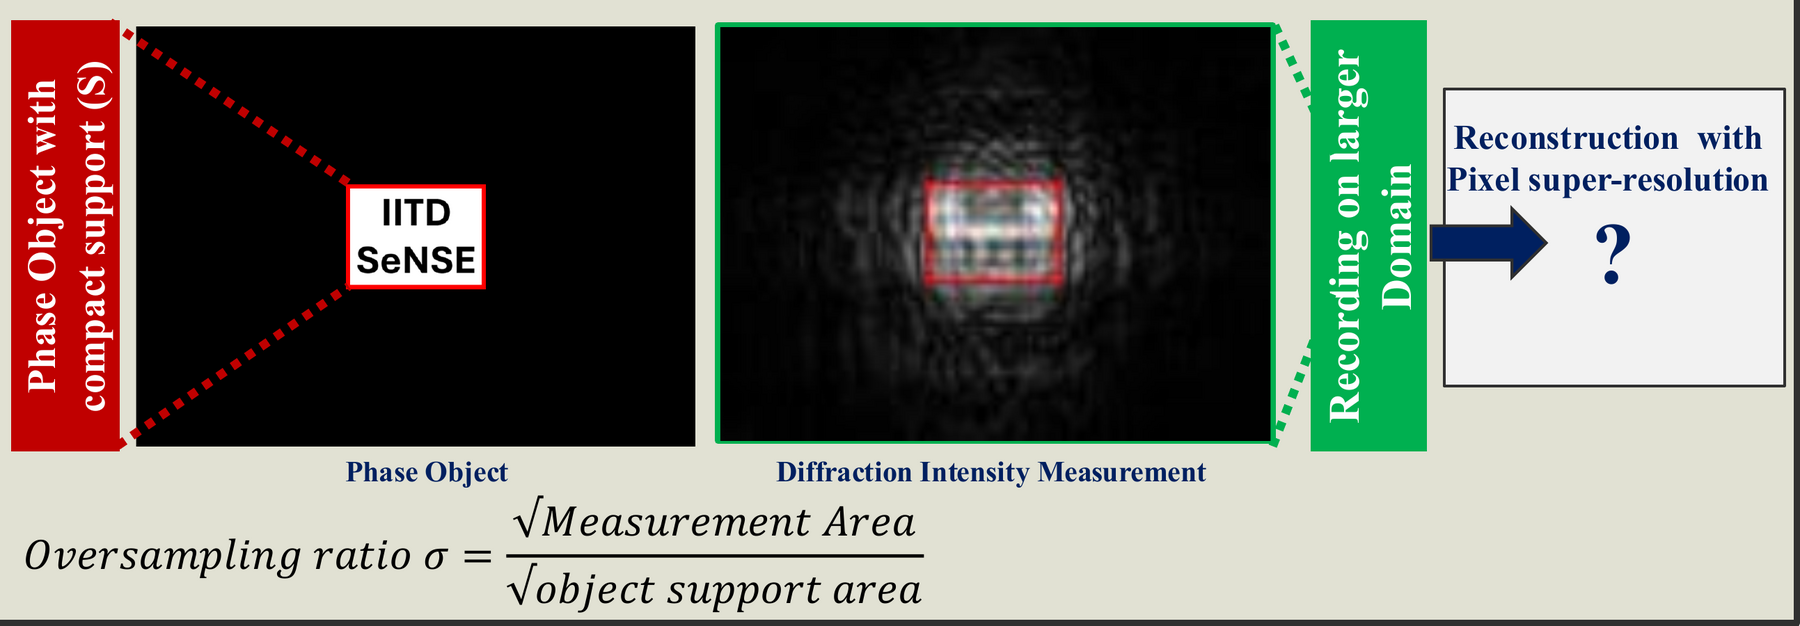
Theory: a pixel-aware forward model
Each pixel integrates the intensity over its area, which we model with a binning operator \(\mathcal{B}_b\) that averages \(b\times b\) blocks of a fine computational grid. With the object restricted to its support \(S\), the measurement is
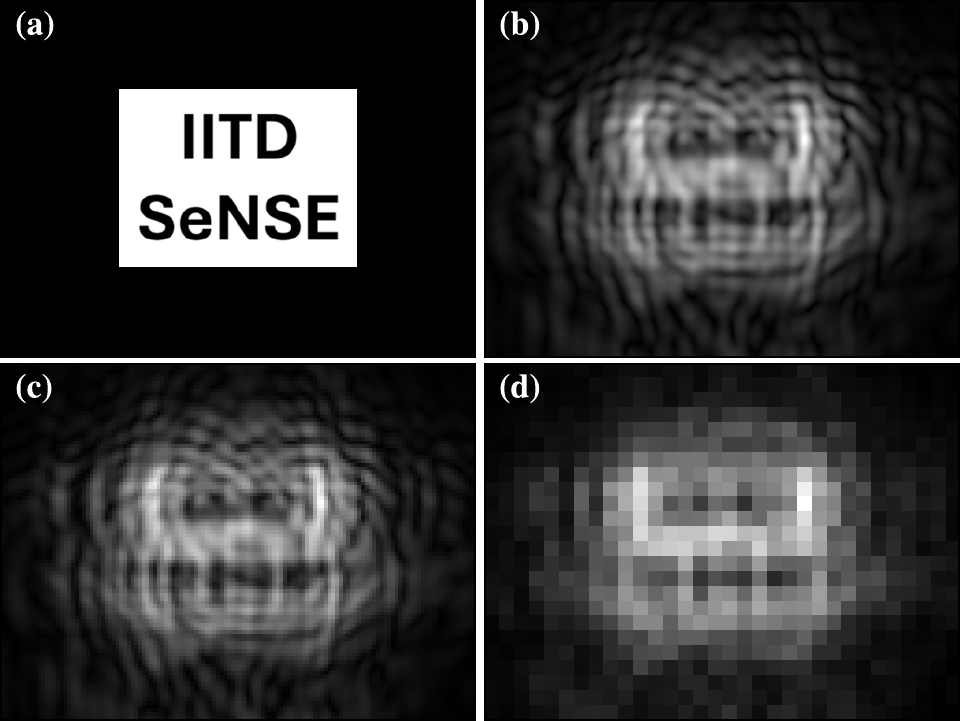
Why this can work: an object with compact support has a Fourier transform that is an entire analytic function, which is determined by its values over any finite region. Free-space propagation spreads the object's high spatial frequencies across the measurement plane, so they are encoded in the fringes, including fringes beyond the object's own extent.
Recording over a larger area raises the measurement-to-unknown ratio
which stabilises the inversion.
The object is recovered on a fine grid by minimising
using a monotone FISTA (accelerated gradient) scheme with projection onto the support after every step. We call the method SCAR-PSR (support-constrained aliasing-reduction pixel super-resolution). The baseline, NU-PSR, uses the same optimiser and support constraint but up-samples the measurement and ignores pixel integration.
Results (numerical study)
Simulation parameters: wavelength 500 nm, 0.25 µm computational grid, phase range 0–π/2, propagation distances 0.35–0.6 mm.
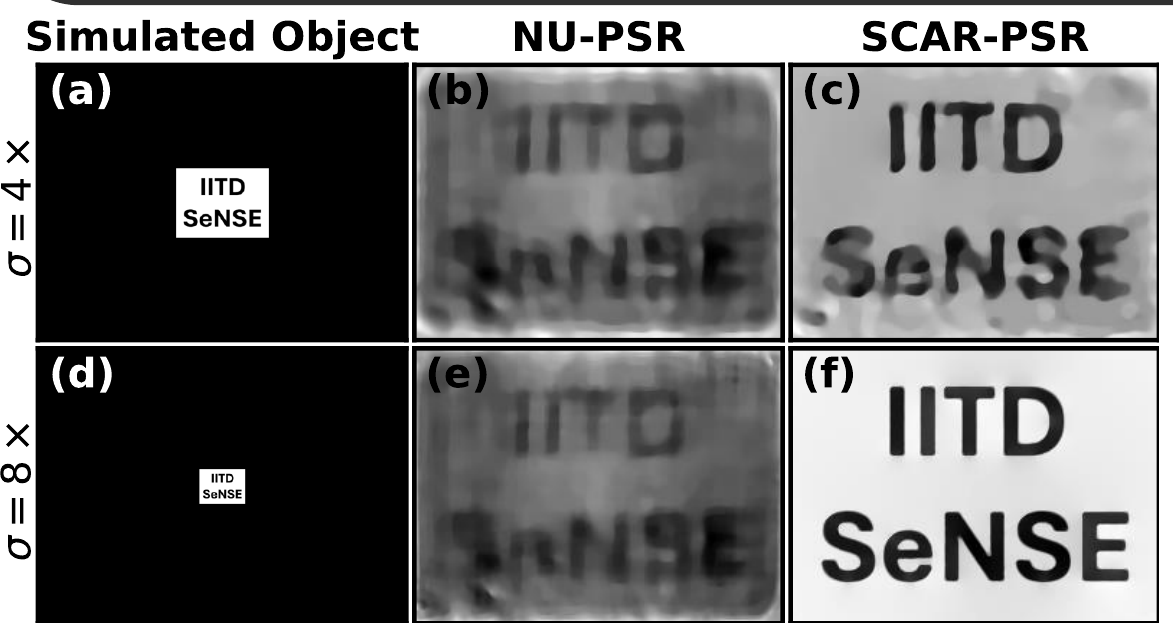
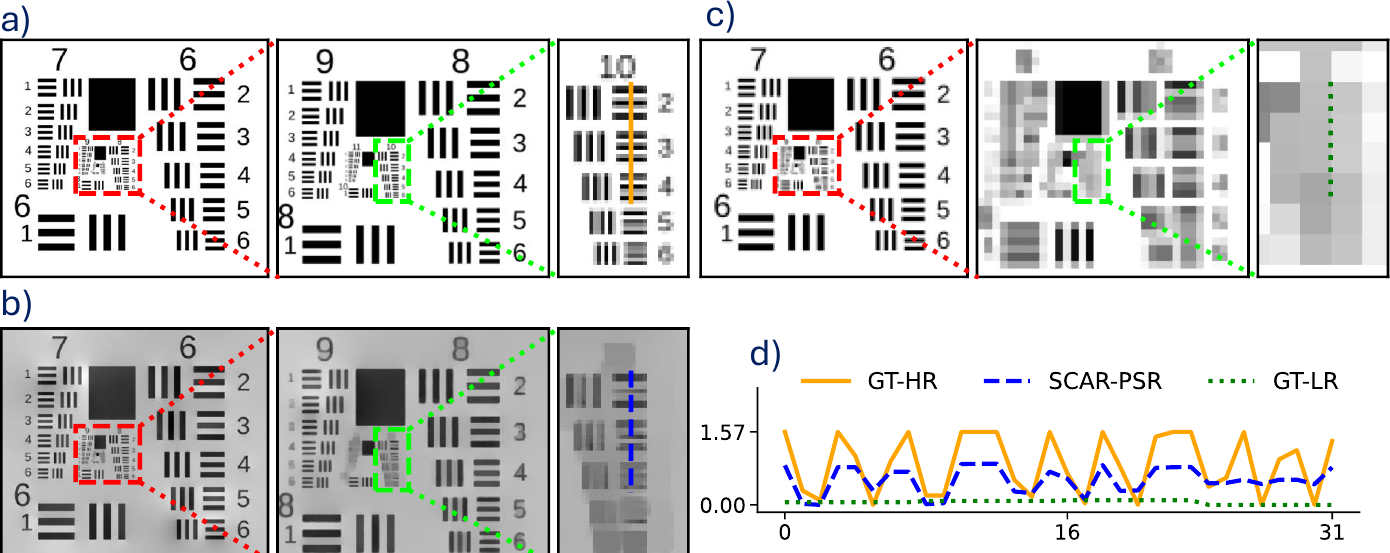
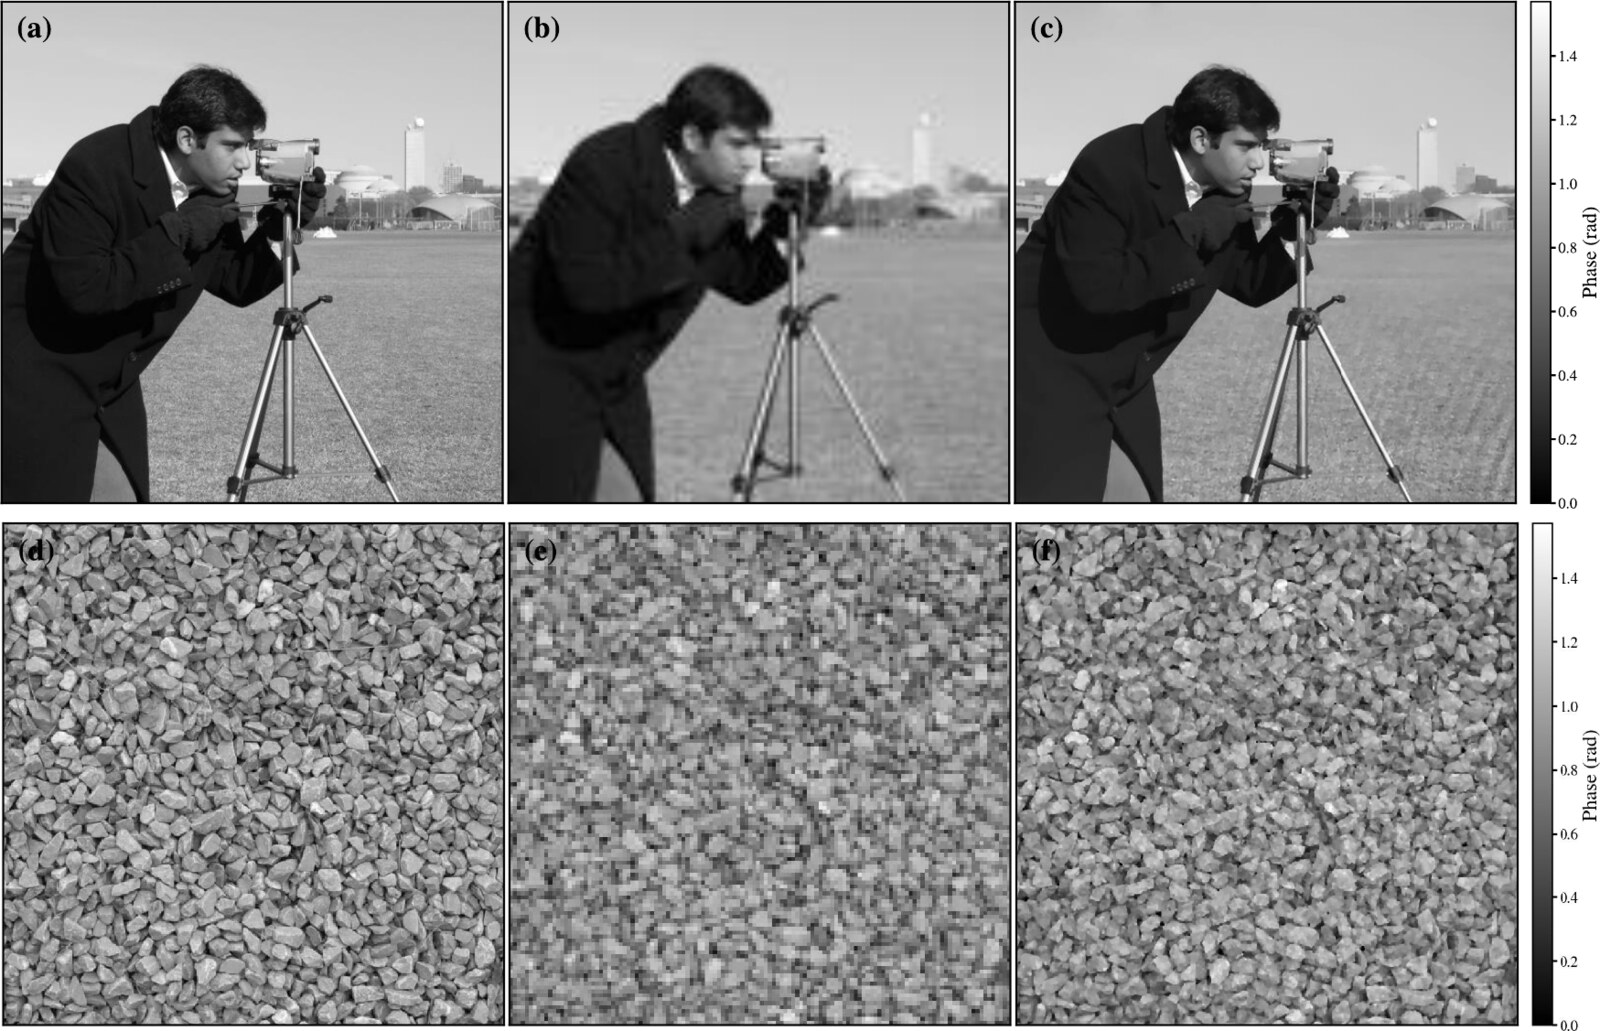
Key numbers
| 8× binning (2 µm pixels) | Phase SNR | PCC | SSIM |
|---|---|---|---|
| NU-PSR (no pixel model) | 12.57 dB | 0.9719 | 0.5285 |
| SCAR-PSR | 24.1 dB | 0.9981 | 0.9128 |
- Half-period resolution of 0.4 µm from 2 µm effective pixels (coherent diffraction limit λ/2 = 0.25 µm).
- Stable reconstruction down to about 500 photons per pixel; phase SNR saturates near 24 dB from six-bit detector precision upward.
- Support constraints alone are not enough. The pixel-integration model is what makes single-shot super-resolution stable.
These results are numerical. Experimental validation and dynamic biological imaging are the next steps. The method needs the sample to be compact compared with the sensor area, i.e. it trades field of view for resolution.
Figures adapted from our Light Day poster and from R. Kamboj, B. S. Ahluwalia and S. K. Dubey, Appl. Opt. 65, 6093–6103 (2026). © 2026 Optica Publishing Group.
Applications and frequently asked questions
Point-of-care diagnostics
Blood cell counting and microfilariae screening from a single wide-field recording, without stains.
Label-free cell monitoring
Live-cell and cell-culture monitoring through quantitative phase, without fluorescent labels.
Water quality
Detection of microplastics and plankton in water samples.
Education and field use
A low-cost, lens-free microscope for teaching laboratories and field settings.
FAQ
Why does light diffract around a cell?
What is the twin-image problem?
How can focus be changed without moving anything?
How does single-shot super-resolution recover detail finer than a pixel?
Documents
Open House poster (PDF) Applied Optics paper (PDF)Our lab
The Laser Applications and Bio-Imaging Laboratory at Centre SeNSE, IIT Delhi works where laser technology meets biological imaging, with the aim of advancing medical diagnostics and scientific research.
Principal investigator
Prof. Satish Kumar Dubey
Professor, Centre for Sensors, Instrumentation and Cyber-Physical System Engineering (SeNSE), Indian Institute of Technology Delhi, New Delhi 110016
- Email: satishdubey@sense.iitd.ac.in
- Phone: +91-11-2659 6752
Current projects
- Field-portable lensless microscope for filariasis detection, funded by BIRAC. The holographic microscope on this page is developed under this project, with AIIMS Nagpur, CDAC Kolkata and CSTM Kolkata as collaborators. It was showcased at Global Bio India 2024, Bharat Mandapam, New Delhi (12–14 September 2024).
- Point-of-care device: a smartphone-based device for early diagnosis of chronic kidney disease.
- Surface-enhanced Raman spectroscopy (SERS): detection of urinary and salivary cotinine.
More on the lab's people, publications, patents and projects: web.iitd.ac.in/~satishdubey